The Problem With More Data
Why More Factory Data Does Not Automatically Create Better Decisions
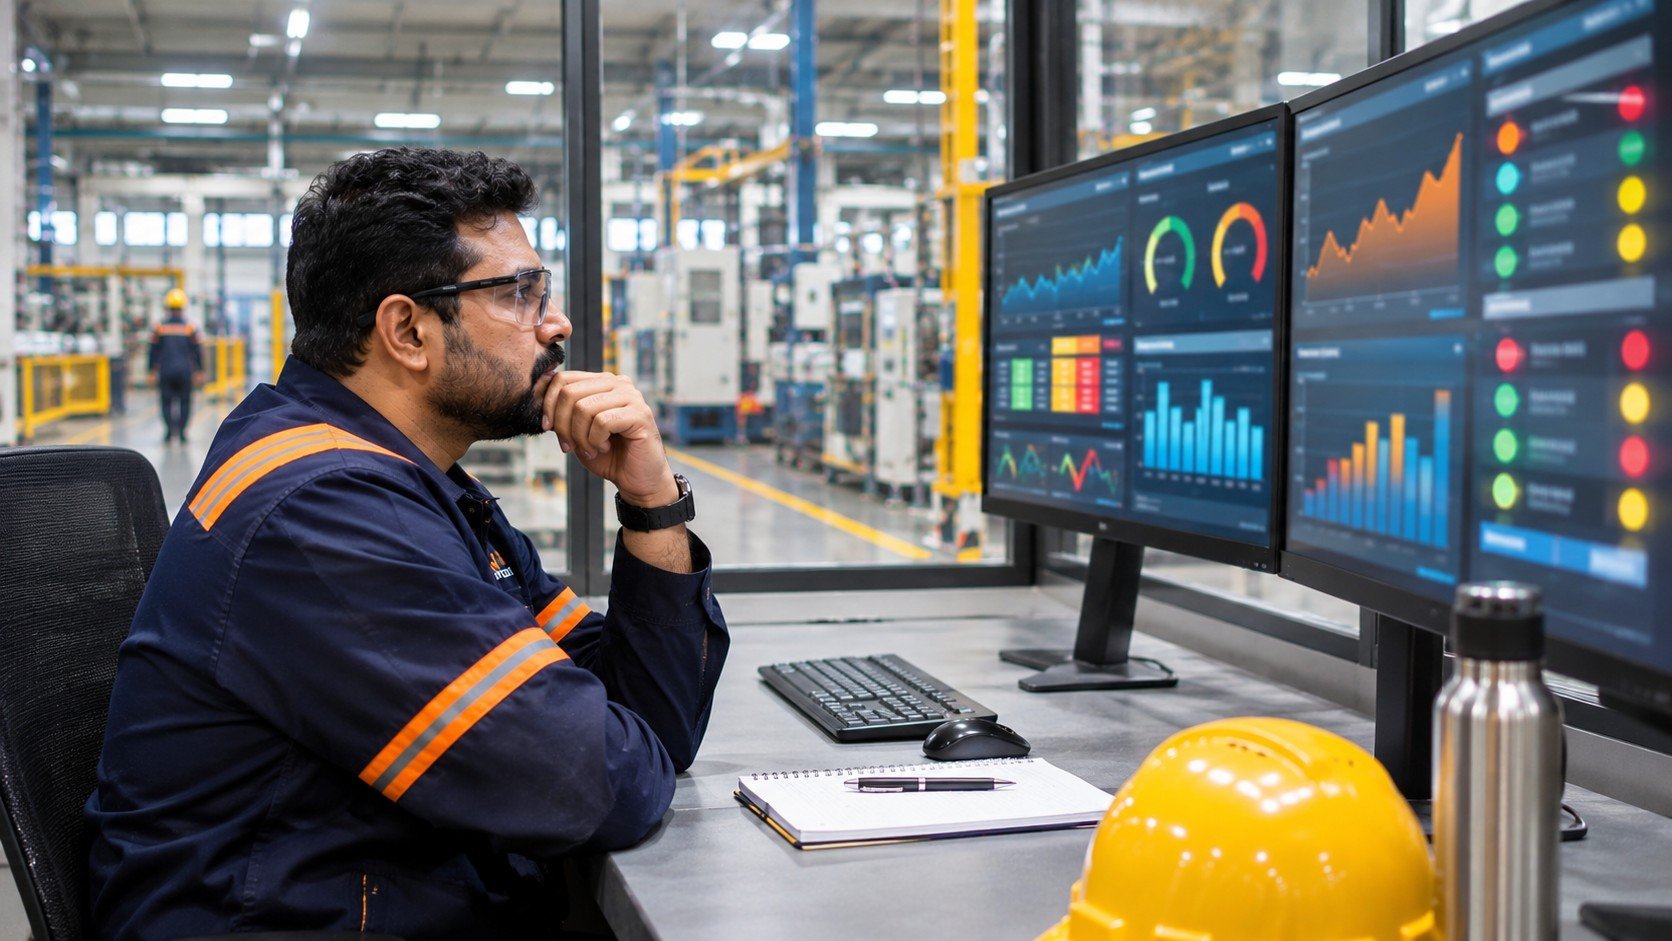
At 8:00 a.m., a production manager opens the plant dashboard. Forty-seven values are visible. Four machines are reporting changes, one line is behind plan, a maintenance indicator is amber and Quality has flagged a deviation.
The dashboard is working as designed. The harder question is what the manager should look at first.
Modern factories collect information from machines, sensors, control systems, maintenance platforms, quality systems and business applications. But visibility alone does not tell people what matters or what requires action.
More data does not automatically create more insight.
The value of factory data depends on whether the system can connect relevant signals to context and support the decisions that follow.
1. From Information to Meaning
A factory can be highly connected without being equally clear.
A sensor reports a temperature. A vibration monitor reports a change. Production output drops. A quality measurement moves outside its recent trend. Each is a signal, but none, by itself, explains what the person should conclude.
A useful sequence is:
Signal → Context → Meaning → Decision
A signal describes a change; context explains the operating state; meaning establishes significance; a decision determines whether to respond, investigate or monitor.
Without these connections, people must interpret disconnected values themselves.
2. The Factory Can Measure More Than People Can Process
Manufacturing systems collect information continuously. Human processing is another constraint.
People have limited capacity to take in information, hold it in memory, make decisions and perform tasks at the same time. The UK Health and Safety Executive explains that excessive workload can slow performance and contribute to slips, lapses and mistakes. Its workload guidance recommends examining what information people need and how competing demands affect them.
An operator may monitor a process, communicate with maintenance and respond to alarms. Another screen does not automatically improve awareness.
The answer is not necessarily less data. It is a deliberate relationship between measurement, meaning and response.
3. Not Every Signal Needs the Same Response
Consider an operator monitoring a process. One value changes because raw-material conditions have shifted. Another moves because the machine enters a different operating mode. A third changes in a pattern that may indicate developing equipment trouble.
The values may look similar on a screen, but their operational significance is different. An information environment should distinguish signals requiring immediate response, information to monitor and data mainly useful for later analysis.
This is especially important for alarms. HSE alarm-management guidance says alarms should direct attention to conditions requiring timely assessment or action. Each alarm should be relevant and have a defined response.
Information needs an operational purpose before it competes for attention.
4. The Signal-to-Decision Test
Choose one dashboard, machine display or recurring report. For each major signal, ask:
Under what condition does this matter?
Then trace:
Signal → Condition → Significance → Response
Observe whether the signal is linked to machine state, product, operating mode or process condition. Identify who interprets it, what decision it supports and what should happen next. This separates operational signals from information intended mainly for analysis or trend review.
The result is a practical distinction between a data-rich interface and a decision-useful one.
5. When Every Change Looks Important
Factories sometimes respond to complexity by adding visibility. Another KPI is added. Another trend is displayed. Another alert is configured. Another dashboard is created.
Each addition can make sense individually. Together, they can make priority harder to see.
An information environment should distinguish what needs attention now from what can be reviewed later. If every change receives the same visual weight, people must create their own priority system. Clear purpose, suitable prioritisation and a defined response are essential. Alarm priority should reflect consequence and the time available to respond.
Information should earn the attention it asks for.
6. Context Changes the Meaning of Data
The same measurement can mean different things under different operating conditions. Vibration may be normal in one machine state and significant in another. A production rate may be acceptable for one product and abnormal for another. A temperature may be expected during startup but concerning at steady state.
Machine state, product, operating mode and maintenance history change interpretation.
NIST research on contextualising manufacturing data for lifecycle decision-making describes the challenge of integrating information across manufacturing stages and placing data in the context needed to support effective decisions.
Asset information and maintenance history can also help establish which record applies.
A measurement may be accurate but misleading without context. Users need to know what it relates to and whether it applies to the current situation.
7. Data Quality Is More Than Accuracy
A sensor can be accurate and still produce low-value information. A dashboard can update in real time while presenting variables with little relevance to the task. A record can be complete but use inconsistent naming. A signal can be valid but lack the context needed to interpret it.
Data quality has an operational dimension. Ask:
- Is the information reliable and current?
- Is it relevant and contextualised?
- Is it presented at the right level of detail?
- Can the intended user understand what it requires?
- Is the next step clear when a condition matters?
Accuracy is essential, but the information must also be relevant and usable.
8. Factory UX: Designing the Information Experience
Factory UX considers how people encounter information around machines, processes and the workplace. It is not just about attractive dashboards or readable displays; it is about grouping, prioritising and representing information so the operational situation is easier to understand.
A display may contain every measurement yet make the important condition hard to recognise. A warning may be visible without explaining the required action.
A good interface makes the operational situation easier to understand. It reflects the task, user's role, consequences of a missed signal and decisions the information must support.
9. Factory OS: Giving Data an Operational Role
Not every useful signal needs to become a human alert. Some should support a workflow.
A machine condition may initiate a maintenance inspection. A quality deviation may trigger escalation. A process condition may change a production instruction. An inspection result may alter maintenance priority.
These are operational relationships. Factory OS structures information, workflows, maintenance processes and workplace controls.
Factory UX shapes how information is encountered and understood. Factory OS connects meaningful information to what the organisation does next.
This prevents every new data point from becoming another screen for someone to monitor. The signal should reach the role, workflow or control that can respond to it.
10. More Dashboards Can Mean More Fragmentation
A production dashboard may serve Production. A maintenance dashboard may serve Maintenance. A quality dashboard may serve Quality. An executive dashboard may summarise all three. Each can be useful, but the machine does not experience those functions separately.
Production, quality and maintenance issues can be connected. If each system presents only its own view, people must join the information across functions.
The question is whether information remains connected when decisions cross functions.
11. Collect Data for a Reason
Digital manufacturing makes it increasingly easy to collect information first and decide how to use it later. That can create large stores of data without a clear operating purpose.
NIST's data analytics for smart manufacturing work highlights the need to connect data acquisition, analytics and decision-support systems.
A better sequence is:
Decision → Insight required → Information required → Appropriate data → Collection method
This starts with a manufacturing need and identifies the information required to support it, without preventing future analysis.
12. From Data Volume to Data Design
The BRIGS approach applies to the information environment.
SEE what people use and act upon.
CONNECT signals to the machine, process, role and workflow.
DIAGNOSE missing or excessive data, weak context, poor prioritisation or fragmented systems.
DESIGN around the decisions the information must support.
IMPLEMENT through interfaces, alerts, analytics, workflows or process changes.
IMPROVE by checking whether people can interpret meaningful conditions and respond without unnecessary complexity.
The system should determine the intervention.
BRIGS Perspective: From Data-Rich to Decision-Useful
At BRIGS, the objective is not to make a factory data-heavy, but to make it more understandable and controllable.
Factory UX considers how people interpret information. Factory OS connects meaningful information to workflows, responsibilities, permissions and controls. Machine and process safety depend on critical conditions being recognised, while workplace improvement ensures the physical environment supports the information system.
The difference is understanding how data, context, people, machines and processes support factory decisions.
A Practical Next Step With BRIGS
Choose one dashboard, machine interface or recurring report. For its main signals, ask:
- What does this measure?
- When does it matter?
- Who needs it?
- What could it change?
- What should happen next?
Separate signals requiring operational response from information for analysis and data with no clear operational purpose.
The aim is not to remove information, but to make its use deliberate. A BRIGS site assessment can extend the review across People, Machines, Processes, Information, Interfaces and Control.
A connected factory does not become smarter by making everything visible. It becomes more useful when the right signals become understandable at the right time.
Related reading

Information at the Point of Work
Factories have more information than ever, yet people still struggle to find what they need when making decisions. Explore how connecting information, context and action can improve manufacturing operations.
When the SOP Works on Paper but Fails on the Shop Floor
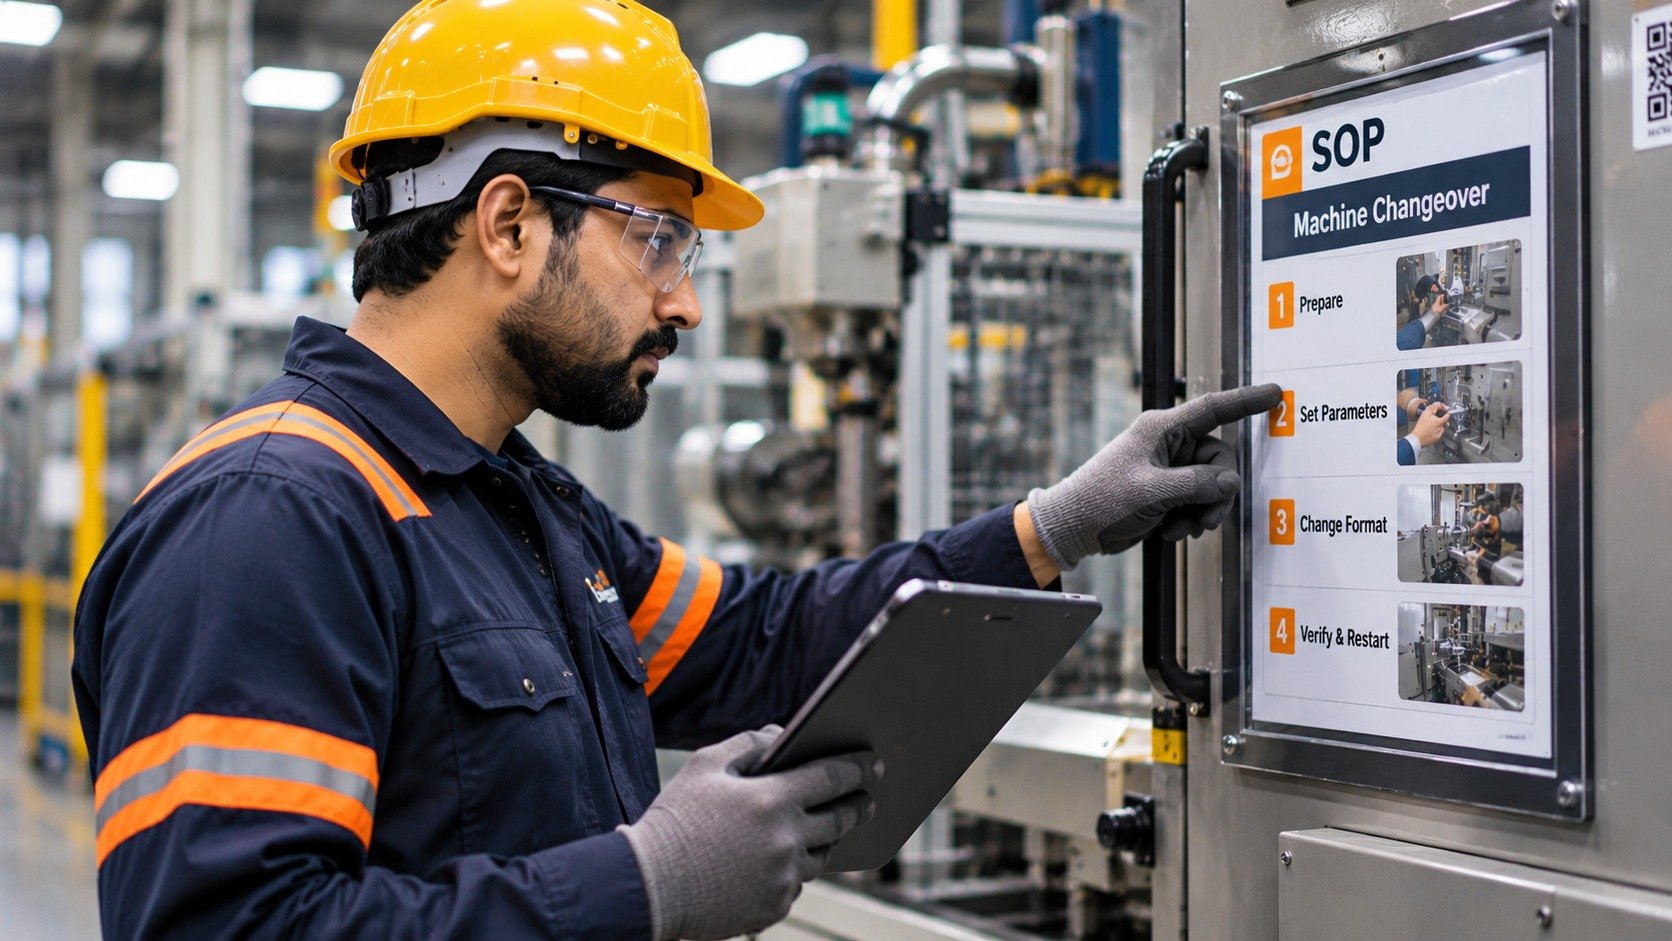
A procedure can be approved and technically correct yet still be difficult to use beside the machine. Explore what makes SOPs clear, accessible and reliable in real operating conditions.
Designing the Point of Work
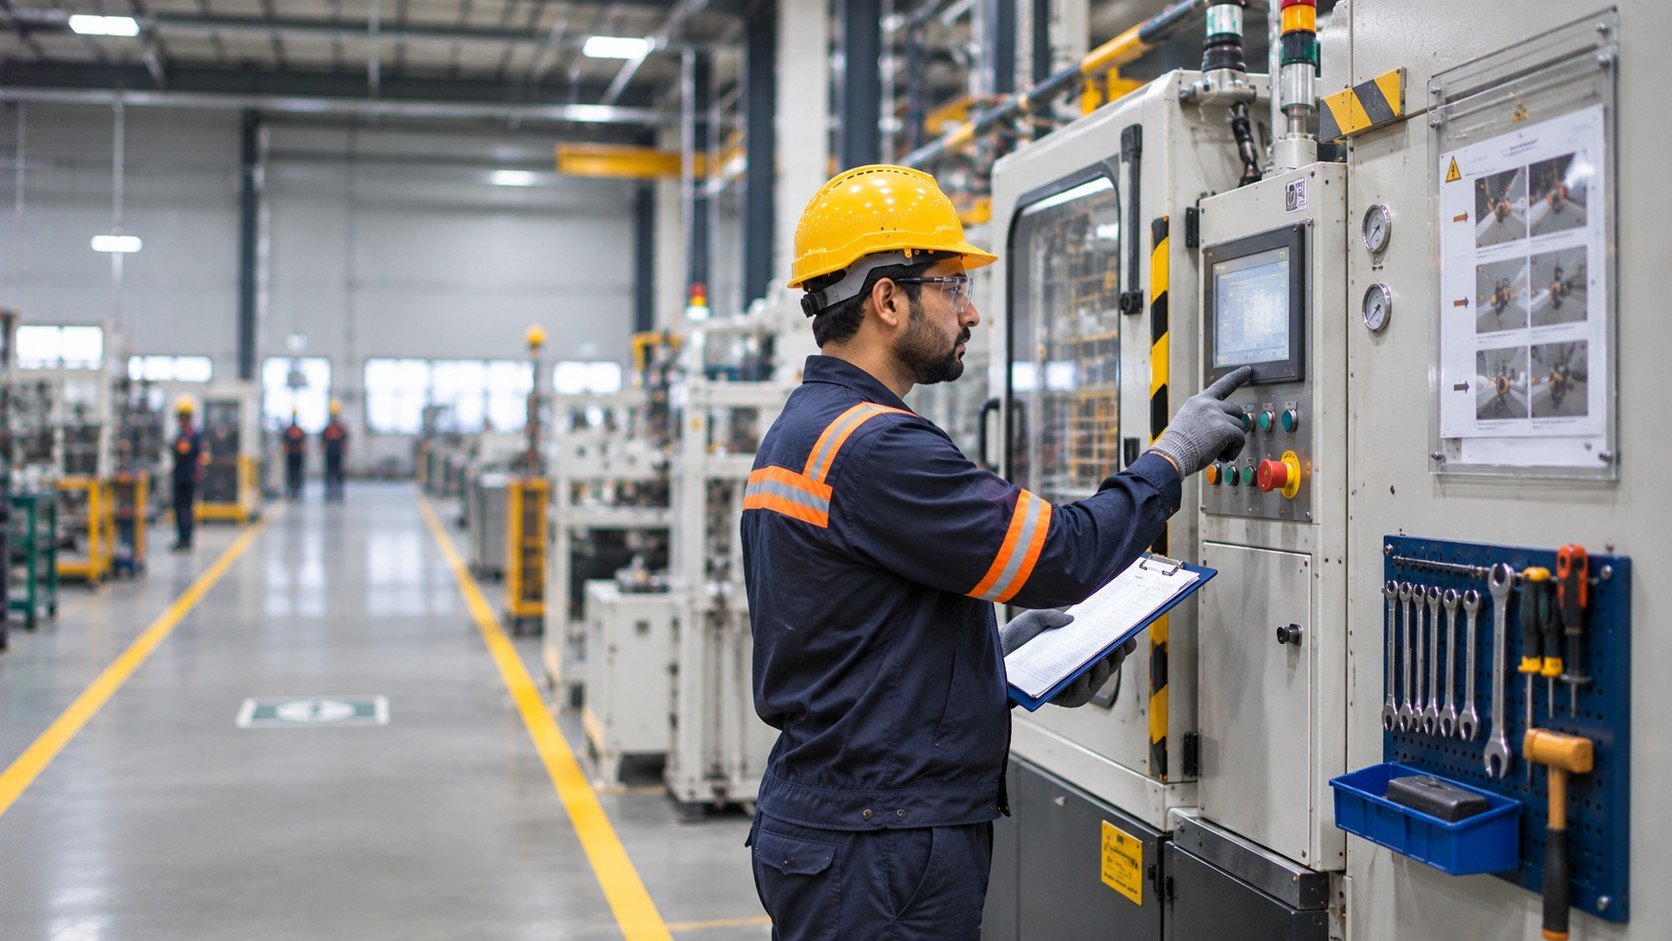
The physical workplace influences how people see, move, understand and perform their tasks. Discover how better workplace design can improve usability, safety and manufacturing performance.
Have a similar challenge on your site?
Tell us what you are trying to improve and we will help you find the practical next step.